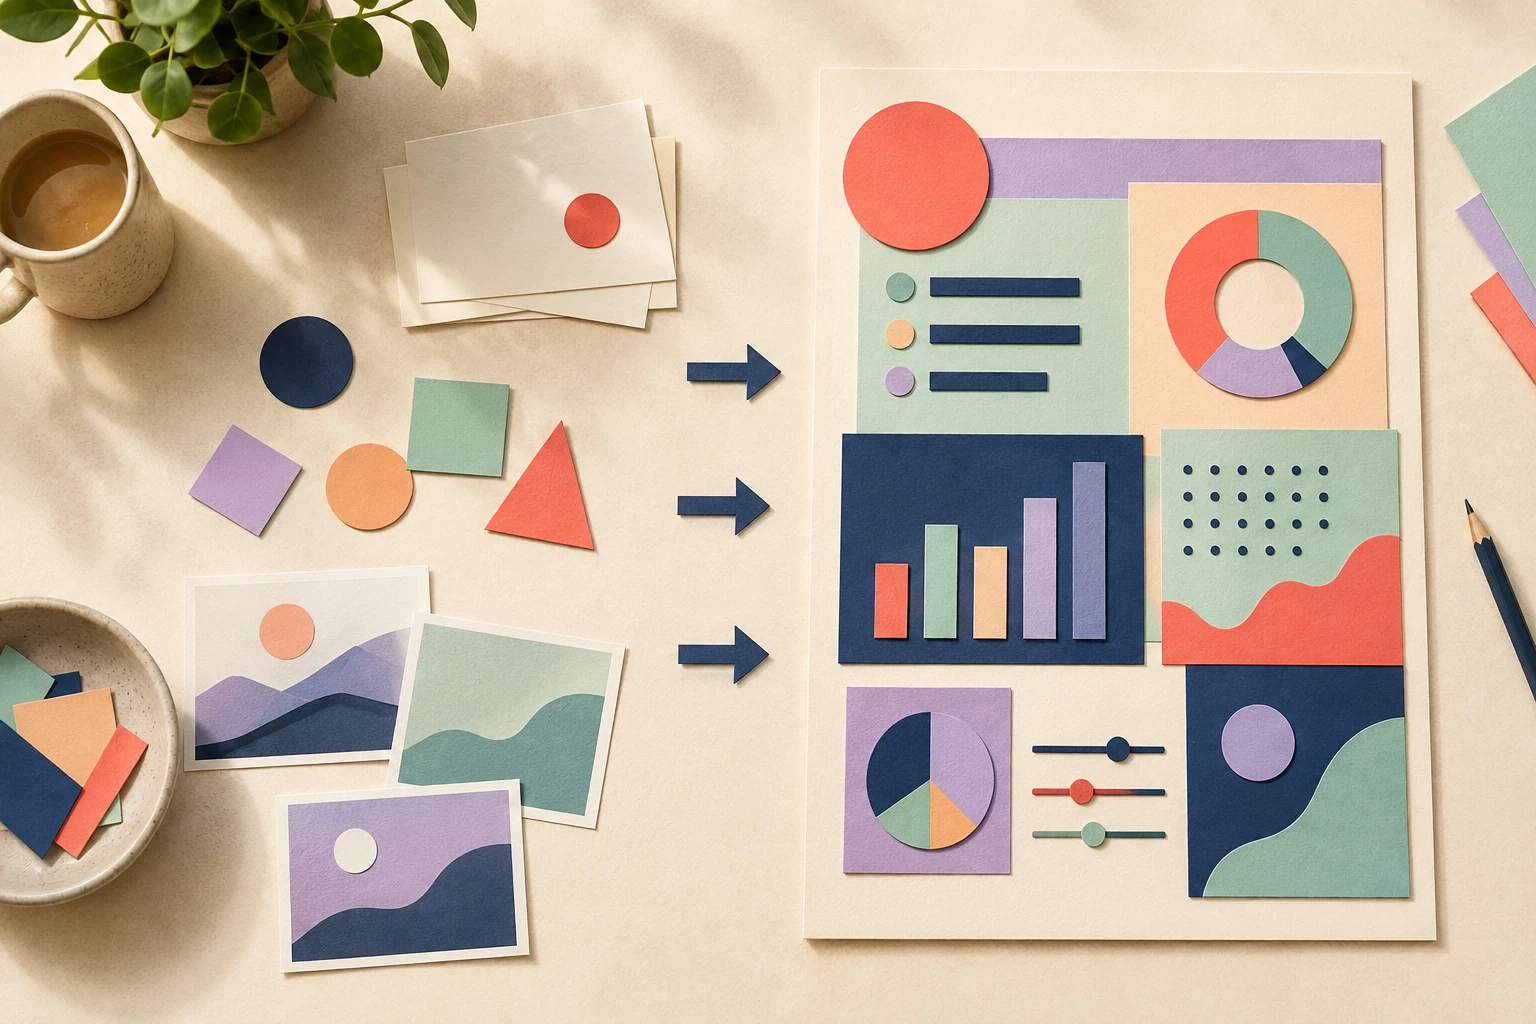
How to Turn a PDF into an Infographic
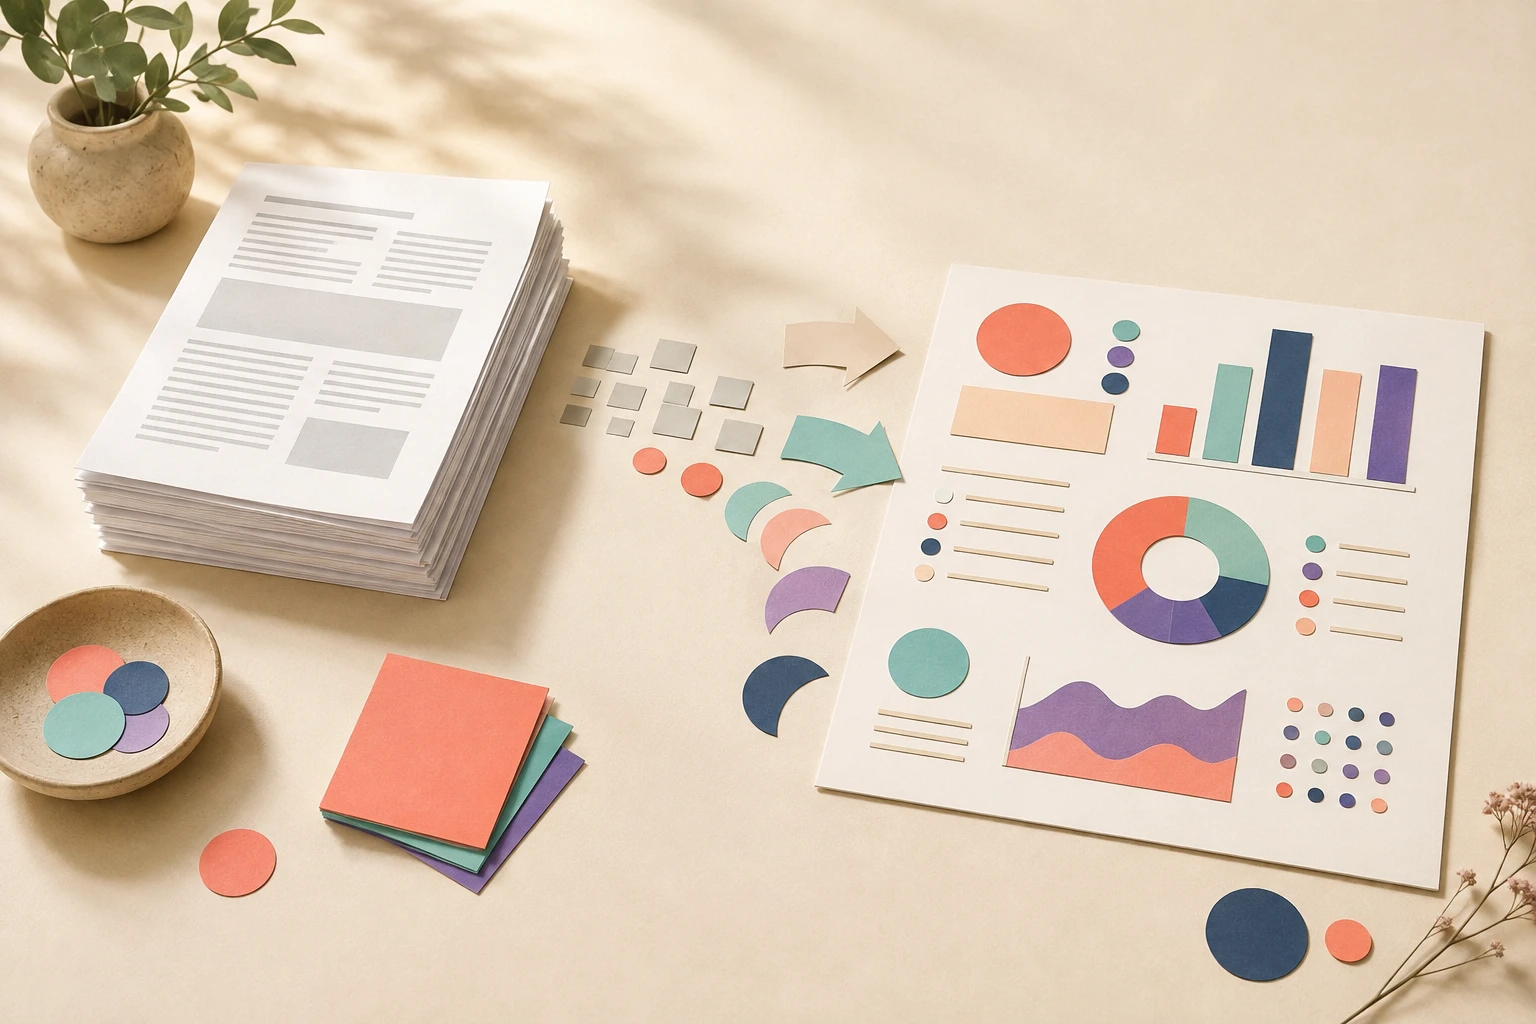
To turn a PDF into an infographic, identify the document's main conclusion, select the pages that support it, and import those pages into a PDF infographic tool. Review the generated summary against the document, request any needed changes, then export the final visual. Vix AI provides this workflow on iPhone and iPad.
Start with a purpose, not the whole document
Decide what the finished graphic should do. A board summary may need the result, three supporting figures, and one recommendation. A study guide may need definitions and the relationship between concepts. A research graphic may need the question, method, finding, and limitation.
Long PDFs often contain material that belongs in an appendix rather than an infographic. Selecting a focused page range reduces noise and gives important facts more room.
Prepare the PDF for conversion
Use a file with selectable text when possible. Check that the pages are upright and readable. If the document contains tables, note which rows or columns matter before importing it. For a scanned document, inspect the extracted wording carefully because poor image quality can introduce errors.
Vix AI lets you import up to five PDFs with up to 100 pages in each file. That capacity is useful for source gathering, but a shorter selection usually produces a more focused visual.
Convert the PDF to an infographic
Step 1: Choose the relevant pages
Find the conclusion and the evidence that supports it. Include definitions only when a reader needs them to understand the result.
Step 2: Import the document
Open Vix AI, choose PDF, and select the file with the iOS document picker. Confirm the page range you want the app to use.

PDF appears beside text, image, data, and AI Search on the creation screen.
Step 3: Pick a visual structure
Use a process flow for procedures, a timeline for events, a comparison for alternatives, or a chart layout for numeric results. A whiteboard summary can connect themes from a report without forcing them into a sequence.
Step 4: Check the generated summary
Compare the title, section labels, names, numbers, and units with the original PDF. Make sure the visual does not imply a relationship that the source did not claim.
Step 5: Refine the design
Ask for one visible change at a time. Increase the title size, add space between sections, simplify the layout, or adjust the color treatment. Recheck the wording after each edit.
Turn a PDF into an infographic with Vix AI.
Step 6: Export the PNG
Choose an aspect ratio and resolution that match the destination. Save the finished PNG to Photos or share it with another iOS app.
Keep the visual tied to its source
Add a source note when the infographic will leave the context of the original document. Preserve the PDF and page references with the exported image. If the source changes, update the graphic rather than continuing to share an old result.
A PDF conversion works best as a clear summary. It should help someone understand the document's main point and decide whether they need to read the full source.
Frequently Asked Questions
Which PDF pages should I include in a visual summary?
Include the pages with the conclusion, the strongest supporting evidence, and any definition required to understand it. Leave background detail out unless it changes the meaning of the result.
How should I verify numbers taken from a PDF?
Compare each displayed number with the original table or paragraph, including the unit and time period. Check that a percentage, total, or average has not been relabeled during summarization.
Put your next idea into a picture.
Turn text, PDFs, and data into shareable infographics on your iPhone. Your first creation is on us.
Download on theApp Store15 welcome credits for new accounts. In-app purchases for continued use.