How to Create an Infographic with AI
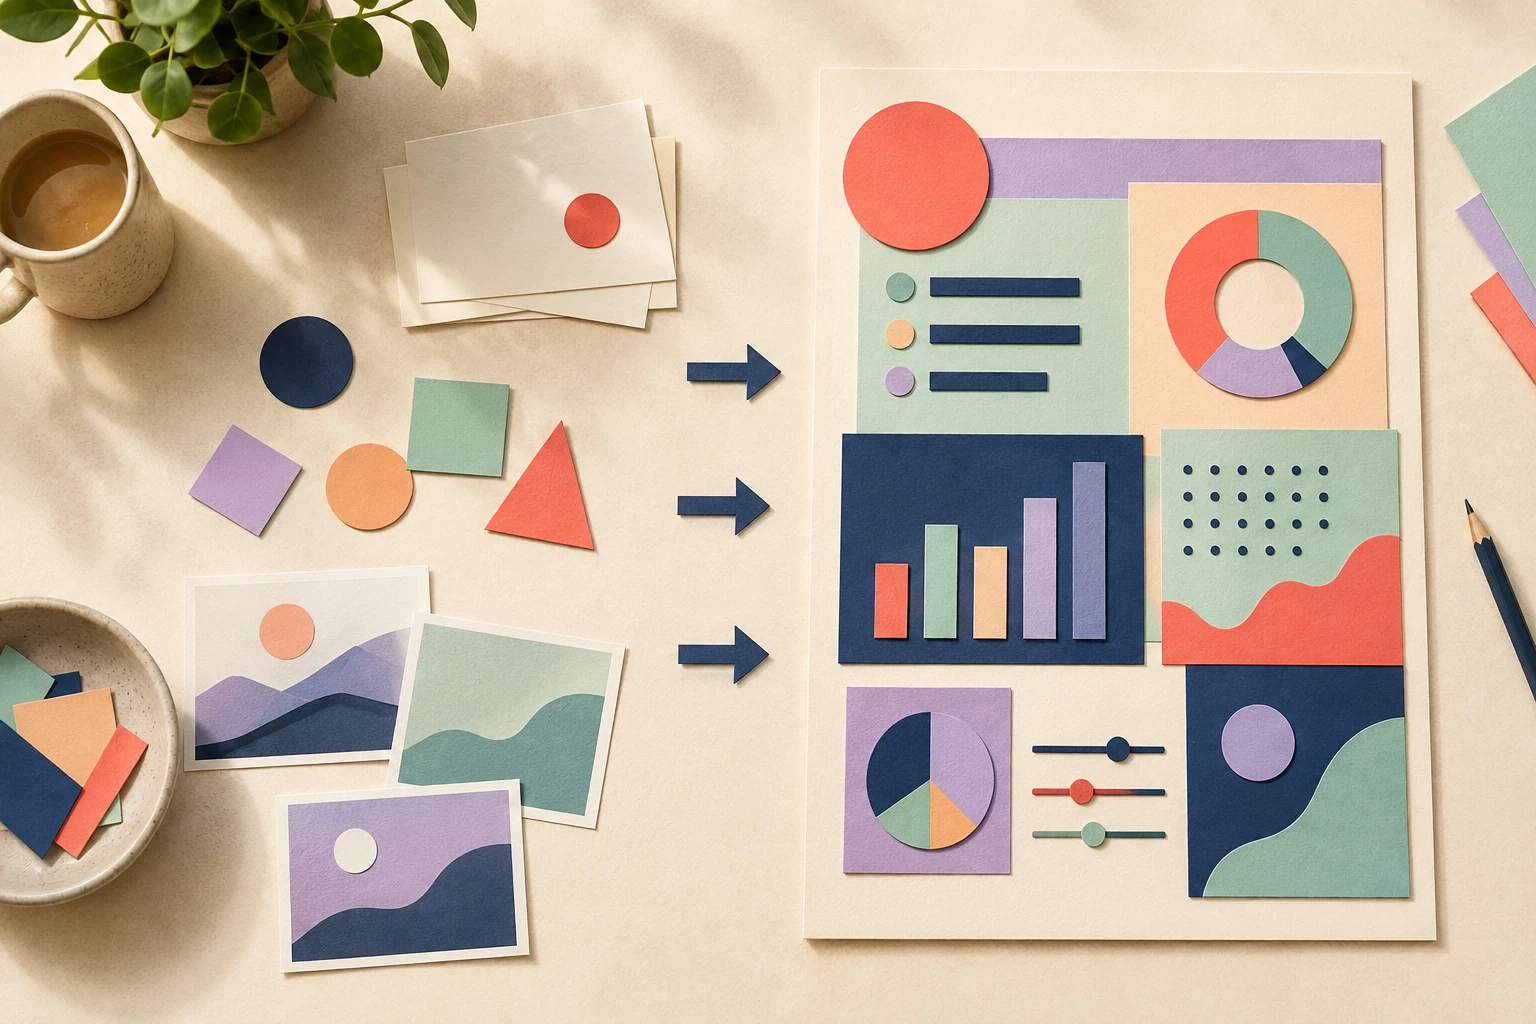
To create an infographic with AI, begin with one clear message and the source material that supports it. Add that material to an infographic generator, choose a structure that fits the message, review every claim, then edit and export the finished image. Vix AI handles that workflow on iPhone and iPad.
Decide what the infographic should explain
A useful infographic answers one question. "How did revenue change this year?" is workable. "Everything about our company" will produce a crowded result because the source has no clear boundary.
Write the main takeaway in one sentence before you open the app. Then collect only the facts needed to support it. Keep source links nearby so you can check names, dates, units, and totals after generation.
Choose the right source
Vix AI offers five starting points. Paste text for notes or an article. Import a PDF when the source is a report or paper. Add an image or screenshot when the information already exists visually. Use Data for a CSV. Choose AI Search when you have a topic but no prepared source.

The current iPhone app offers five ways to start an infographic.
Prepared material gives you more control over the facts. Topic search is useful for exploration, but check the generated claims against reliable sources before sharing them.
Follow the AI infographic workflow
Step 1: Add focused source material
Paste or import the smallest useful set of information. For a long document, select the pages that contain the conclusion, supporting figures, and any definitions the reader needs.
Step 2: Pick a layout that matches the content
Use a timeline for events, a comparison for two sides, a process flow for ordered actions, and a data chart for quantities. Whiteboard summaries work well for connected ideas. Anatomy layouts fit a labeled object or system.
Step 3: Generate and read the whole result
Check the title first, then follow the intended reading order. Make sure the most useful point appears early and that no section depends on tiny text. Compare every number and factual statement with your source.
Step 4: Ask for a specific edit
The app accepts written changes such as "make the title larger," "add more white space," or "use a darker background." Give one concrete instruction at a time. A narrow request is easier to judge than a broad request to "make it better."
Create your first infographic in Vix AI.
Step 5: Choose the output and export
Select the aspect ratio for the place where the infographic will appear. Vix AI can generate 1K, 2K, or 4K output and saves the result as a PNG. Use the iOS share sheet to send it to another app.
Review before you publish
AI-generated visuals still need an editor. Confirm that charts represent the source values, labels use consistent units, and dates have not shifted. Read the image at the size your audience will see. A graphic that looks clear on an iPad may have text that is too small in a phone feed.
Keep the original source with the exported image. If someone questions a figure later, you should be able to find the exact page or row it came from.
Frequently Asked Questions
What should I write before generating an infographic?
Write one sentence that states the intended takeaway, then list the few facts needed to prove it. This gives the generator a clear hierarchy and makes the result easier to review.
How many ideas should one infographic contain?
One main idea with a small set of supporting points is usually enough. Split unrelated topics into separate graphics so each image has a clear reading order.
Put your next idea into a picture.
Turn text, PDFs, and data into shareable infographics on your iPhone. Your first creation is on us.
Download on theApp Store15 welcome credits for new accounts. In-app purchases for continued use.