How to Make a Social Media Infographic

To make a social media infographic, choose one point that is useful without extra context, write a short source-backed outline, and design for the size people will actually see in the feed. Use a vertical or square aspect ratio when appropriate, test the image on a phone, and keep a source note with the post.
Pick one reason to stop scrolling
A social graphic has a few seconds to communicate its subject. Lead with the result, comparison, question, or process that matters most. A report with six themes may need six posts rather than one dense image.
Use the post caption for context and links. The image should carry the core idea, supporting evidence, and enough source information to be credible. Do not force a full article into small type.
Build the social infographic
Step 1: Write a compact outline
Draft a clear title, one main claim, and a small set of supporting points. Check facts before design begins. If you use a statistic, record its source and date.
Step 2: Add the source to Vix AI
Paste prepared text, import a PDF, add an image, choose CSV data, or start with a topic. Prepared source material is easier to verify because you know exactly what the graphic should contain.
Step 3: Choose a suitable layout
Use a listicle for a compact set of tips, a comparison for two options, a timeline for events, and a process flow for ordered steps. Educational posters can explain a concept, while data charts give quantities a clear structure.
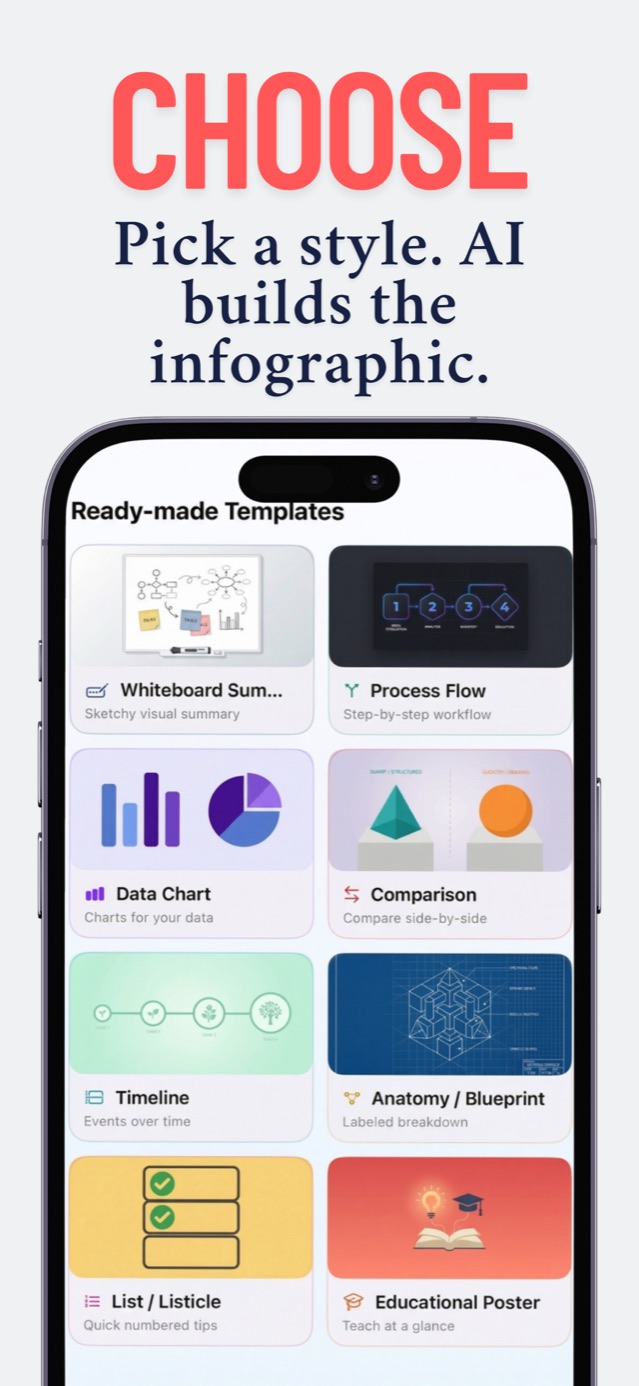
Choose the structure before you tune color or decoration.
Step 4: Select the output shape
Match the aspect ratio to the placement where the image will appear. Leave safe space near the edges because previews and crops can vary. If you plan to reuse the graphic in several places, create separate versions instead of relying on one automatic crop.
Step 5: Review at phone size
Open the preview on a phone and read it without zooming. Check the title, the smallest label, and any chart legend. Remove secondary copy when the layout feels tight. A shorter graphic that can be read is more useful than a complete graphic that cannot.
Make a social infographic with Vix AI.
Step 6: Export and publish with context
Save the PNG at the resolution you need. Write a caption that states where the information came from, provides any caveat, and gives the reader a next step. Keep the original source and final export together so you can update the post if a figure changes.
Create a series without making clones
For a group of related posts, keep a consistent palette, title position, and type scale. Change the layout when the information changes. A comparison and a timeline can look related without sharing the same structure.
Review the full set as thumbnails. The subject of each card should remain clear, and no single image should look much denser than the rest.
Frequently Asked Questions
Should a source URL appear inside a social infographic?
Use a short source name or compact reference when the claim needs attribution, then put the full link in the caption or accompanying page. Make sure the image and caption cannot be separated in a misleading way.
Can I reuse one infographic across different social platforms?
You can reuse the content, but each placement may need a different crop or aspect ratio. Export separate versions and check the text size in each one before posting.
Put your next idea into a picture.
Turn text, PDFs, and data into shareable infographics on your iPhone. Your first creation is on us.
Download on theApp Store15 welcome credits for new accounts. In-app purchases for continued use.